Home » Walkability » Recent Articles:

Thinking Ahead To When The Kids Leave The Nest

Dining & entertainment just blocks from many lofts.

Recently a friend of 40+ years, living in suburbia, posted on Facebook she didn’t know what she’ll do when her two boys move out of the house.   I had to confirm with her, but the oldest is not yet 13.

Empty Nest Syndrome refers to feelings of depression, sadness, and/or grief experienced by parents and caregivers after children come of age and leave their childhood homes. This may occur when children go to college or get married. Women are more likely than men to be affected; often, when the nest is emptying, mothers are going through other significant life events as well, such as menopause or caring for elderly parents. Yet this doesn’t mean that men are completely immune to Empty Nest Syndrome. Men can experience similar feelings of loss regarding the departure of their children.

More mothers work these days and therefore feel less emptiness when their children leave home. Also, an increasing number of adult children between 25 and 34 are now living with their parents at home. Psychologist Allan Scheinberg notes that these “boomerang kids” want the “limited responsibility of childhood and the privileges of adulthood.” Children may also return home due to economics, divorce, extended education, drug or alcohol problems or temporary transitions. (Psychology Today)

From a 2011 story on Census data:

According to the data set, entitled America’s Families and Living Arrangements: 2011, the number of 25 to 34 year olds living with mom and dad has risen among both sexes since 2005: the number of young men living with parents is up from 14% to 19% and the number of young women is up from 8% to 10%. The Census’ graphs indicate that the numbers of older Generation-Yers living under their parents’ roofs — a number that had already been trending up before the “Great Recession” — continued to shoot up following the financial meltdown of 2008, specifically from the beginning of 2009 onwards. (Forbes)

If this continues my friend may not find out what an empty nest is like.

My loft building has all age groups, including many Baby Boomers, that sold their suburban homes for a walkable life downtown. Not for everyone, but the 10,000 a day who turn 65 are impacting the marketplace:

America’s aging population is already placing different demands on the housing market and affecting what developers will likely be focused on providing, according to Terry Holzheimer, director of economic development in Arlington County, Virginia. He’s expecting to see more infill housing, more housing in areas that are walkable, and more pedestrian-oriented neighborhoods with high levels of services and amenities. (The Atlantic Cities)

Some of you will likely argue why empty nesters will keep the suburban nest rather than relocate to a more walkable area. Certainly, many will stay in the home where they raised their kids. Others, like neighbors of mine, will switch places. The kids now with kids of their own will move into the parents house and the parents will move into the kids loft.

— Steve Patterson


Study: Connection Between Transit and Real Estate Value

A study released this month looked at five regions and found a connection between home values and transit:

From the Executive Summary:

Overall there was a substantial decline in average residential sales prices in the study regions between 2006 and 2011. However, in all of the regions, the decline in average residential sales prices within the transit shed was lower than in the region as a whole or the non-transit area. Across the study regions, the transit shed outperformed the region as a whole by 41.6 percent. Figure 1 shows the percent change in average residential sales prices in the transit shed and non- transit area relative to the regional percent change in price.

Within a given region, heavy rail, light rail, and BRT transit sheds held their value best. In addition to having higher frequency service and better transit connectivity, these types of fixed-guideway transit stations also tend to be located in areas that are more walkable, have higher residential density, and better access to jobs. Commuter rail sheds also saw a smaller decline in average residential sales prices than the region as a whole.

Percent change in average residential sales prices relative to the region, 2006-11
apta-nar2
Click cover image to view the 39-page study from the American Public Transportation Association and the National Association of Realtors.

From the Conclusion:

Transit type also had an effect on the resilience of property values, which benefited more from transit that was well connected and had a higher frequency of service. Although most commuter rail transit sheds still saw a smaller decline in average residential sales prices than the region as a whole, heavy rail, BRT, and light rail transit sheds outperformed commuter rail transit sheds within and across regions. Heavy rail transit sheds had significantly higher levels of transit access, as measured by the Transit Connectivity Index and the Transit Access Shed, than the commuter rail sheds. Average monthly household transportation costs were also substantially lower in the heavy rail than the commuter rail sheds, indicating that the heavy rail sheds had not only higher levels of transit service, but were more location efficient overall. For most property types, the transit shed outperformed the region; however, unlike with transit type, there were no consistent trends across regions.

In addition to providing consumers and planners with information, the findings support investment in transit and encourage development in location efficient areas. The presence of fixed-guideway transit not only benefits individual property owners, it also supports a more resilient tax base.

I read about the study here. This is no surprise to many of us, but others won’t believe the results. “Everyone aspires to a McMansion in suburbia and driving everywhere” they’ll proclaim.

It’s 2013, not 1963!

– Steve Patterson


Springfield IL & Niemann Foods Don’t Understand Pedestrian-Friendly Design

Recently a reader in Springfield IL, the Illinois state capital 90 miles from St. Louis, alerted me to a new County Market grocery store about to open on the NW edge of their downtown. A local newspaper article  talked about the 11,000+ residents within a mile of downtown Springfield and 68,000+ within 5 miles. Tom Moore, director of the new store, was quoted:

“All day long, they come in and say, ‘When are you going to open?’” said Moore. “With the hospitals close by and the apartments close by, we’re expecting quite a bit of foot traffic here. “We’re targeting the whole downtown area, whether it’s the medical community or the neighborhoods.” (State Journal-Register)

Great, they recognize there are many people in the area and they expected lots of foot traffic. Memorial Medical is 2/10th of a mile to the north and St. John’s Hospital is a half mile directly east. County Market is a 100-store chain operated by Niemann Foods based in Quincy IL, an affiliate of Supervalu.  Supervalu is the parent company of St. Louis-based chains Save-A-Lot and Shop ‘N Save. More on the new market later. Springfield’s Regional/Urban Design Assistance Team (R\UDAT)  report from 2002 speaks briefly to making downtown pedestrian-friendly:

As a neighborhood, downtown Springfield should offer a pedestrian friendly environment with pleasant streetscapes, welcoming crosswalks, green space, or other “softscape” areas, parallel or diagonal parking as a buffer from vehicular traffic, adequate signage and easy to understand “way-finding” systems for visitors. The “way-finding” system should be easy to use, but should be somewhat unobtrusive in keeping with the neighborhood environment. Although the linkages are not yet established, the contiguous districts of commercial and historical importance in Springfield – the Lincoln home, the Capitol District – are very walkable from the central downtown core. A visitor will find it convenient to park in downtown Springfield and walk to these and other nearby attractions. Such programs as Lincoln Walks to Work and Looking for Lincoln will reinforce this walk-ability and contribute to the linkages between the downtown and the Lincoln home neighborhood. (Downtown as a Neighborhood)

In that same section they recognized the need to for additional retail to serve local needs, including a grocery store:

The retail mix should meet the needs of the downtown residents, the downtown employees, the residents in the neighborhoods surrounding downtown and downtown visitors and tourists. This mix should include coffee shops, gourmet retail and take out, bookstores, general grocery and merchandise, dry cleaners that offer bundle service, souvenir and general gift shops, ice cream, bakery and other service based businesses for residents. Bringing these uses into the downtown depends on achieving a larger resident population and the resulting greater purchasing power.

The Springfield Strategy 2020 report, completed in 2010, certainly says all the right things speaks more to making Springfield pedestrian-friendly:

“The Springfield of 2020 has preserved residential neighborhoods surrounding the downtown, which boosts pedestrian traffic in the downtown historic district and acts as a buffer to protect the downtown core.” (p23) “We believe that an effective transportation system must also include facilities to encourage biking and pedestrian traffic.” (p27) “The Springfield of 2020 will be pedestrian friendly with sidewalks being maintained, constructed and reconstructed when necessary throughout the city. This is but one way that the Springfield of 2020 will be know as a city that stresses better accessibility for all of its citizens. In addition, requirements for new subdivisions will be developed to encourage the development of amenities for walking and bicycling, as well as additional green space in all new subdivisions.” (p27) “The Springfield of 2020 will include bike paths downtown that have been sponsored and built by the city to encourage biking to area businesses and work places. The city will also develop new pedestrian walkways to encourage pedestrian traffic to historic and government sites so as to reduce downtown vehicular traffic and increase tourist use of area businesses.” (p27)

Great, Springfield seemed to know what was needed to achieve their objectives. Or not… The new County Market that’s expecting lots of pedestrians opened on March 8th, I visited on the 21st.

The main entrance faces west, with a surface parking lot between the 2nd Street public sidewalk and the door. No ADA accessible  route is provided.
The main entrance faces west, with a surface parking lot between the 2nd Street public sidewalk and the door. No ADA accessible route is provided.

Remember, they’re expecting lots of foot traffic to this store. But 2nd Street is a minor road, Carpenter Street is a main arterial. But access is no better from that new public sidewalk.

Looking east on Carpenter St from the County Market auto driveway
A second entrance to County Market is located on the corner, facing Carpenter St.
A second entrance to County Market is located on the corner, facing Carpenter St. Seeing the marking on the pavement you might think that was to guide pedestrians safely to the public sidewalk.
But it leads to disabled parking, not the sidewalk.

Again, they’re expecting lots of foot traffic yet they’ve made zero provisions for all these pedestrians to reach the store. Like so many places, the pedestrians will be forced to compete with the cars.

A customer in a manual wheelchair leaves the County Market via the auto exit on 3/8/2013, opening day. Photo by Steven Simpson-Black

Springfield wants to be pedestrian-friendly by 2020, but they allow this to happen? They also assembled the land and did a $2 million dollar TIF!

Planning and Economic Development Director Mike Farmer hopes it will act as a catalyst for further business growth near the city’s downtown and medical district.

Niemann Foods says 110 full and part-time staff have been hired from the area. The store’s floor plan and design has been called more “urban” than most County Market locations.

The smaller store features a coffee shop with drive-through window and upstairs lounge/dining area with free wireless internet access. A similar store has been built in the heart of the University of Illinois’ Champaign-Urbana campus. (WUIS)

The County Market location at 331 E Stoughton St, Champaign, IL (Google Maps) has the same look, two entrances, and an upstairs — unfortunately that’s where the similarities end. Champaign’s corner entrance is on a different corner and placed at the intersection, while the main entrance faces a surface parking lot.

The secondary entrance to the County Market in Champaign IL helps define the street and welcomes pedestrians.  Source: Google Maps/Streetvew
The secondary entrance to the County Market in Champaign IL helps define the street and welcomes pedestrians. Source: Google Maps/Streetvew
The main entrance in Champaign fronts onto another street with the parking lot on the opposite side.
The main entrance in Champaign fronts onto another street with the parking lot on the opposite side. Source: Google Maps/Streetvew

The Champaign County Foods store lacks the two drive-through windows of Springfield — one for coffee and one for pharmacy. I’m pretty sure drive-through service windows decrease pedestrian traffic, not increase it.

Springfield & Niemann Foods had a chance to build a good urban prototype that would’ve been equally accessible by pedestrians and motorists, but they blew it big time. They need to at least provide an ADA Pedestrian Route from both Carpenter and 2nd Streets to each entrance.

Municipalities and businesses in the St. Louis region make the same mistakes too often.

– Steve Patterson


Urban Planning and Generational Differences

Our life experiences shape our decisions and outlook on life. My parents, born in 1929 & 1931, were raised  poor on the fringes of the worst part of the Dust Bowl in western Oklahoma. Their upbringing, by fathers born in the late 19th century, and moms from the early 20th century, was radically different than my childhood in a 1960s suburban subdivision.

xyzA couple born in the same years as my parents, but raised affluent in Ladue, are still going to have shared characteristics with my poor rural folks just as I will with their child born the year I was, even if s/he has a trust fund. Because of these shared characteristics demographers make generalizations of each generation based on the study of millions over time. Do these generalizations fit every individual from a given generation? Of course not, they are summations of tens of millions.

Wikipedia has a good summary of the seven most recent generations:

  1. The Lost Generation, also known as the Generation of 1914 in Europe, is a term originating with Gertrude Stein to describe those who fought in World War I. The members of the lost generation were typically born between 1883 and 1900.
  2. The Greatest Generation, also known as the G.I. Generation, is the generation that includes the veterans who fought in World War II. They were born from around 1901 through 1924, coming of age during the Great Depression. Journalist Tom Brokaw dubbed this the Greatest Generation in a book of the same name.
  3. The Silent Generation, also known as the “Lucky Few” were born 1925 through 1945, is the generation that includes those who were too young to join the service during World War II. It includes most of those who fought during the Korean War. Many had fathers who served in World War I. Generally recognized as the children of the Great Depression, this event during their formative years had a profound impact on them.
  4. The Baby Boomers are the generation that was born following World War II, generally from 1946 up to 1964, a time that was marked by an increase in birth rates. The term “baby boomer” is sometimes used in a cultural context. Therefore, it is impossible to achieve broad consensus of a precise date definition. The baby boom has been described variously as a “shockwave” and as “the pig in the python.” In general, baby boomers are associated with a rejection or redefinition of traditional values; however, many commentators have disputed the extent of that rejection, noting the widespread continuity of values with older and younger generations. In Europe and North America boomers are widely associated with privilege, as many grew up in a time of affluence. One of the features of Boomers was that they tended to think of themselves as a special generation, very different from those that had come before them. In the 1960s, as the relatively large numbers of young people became teenagers and young adults, they, and those around them, created a very specific rhetoric around their cohort, and the change they were bringing about.
  5. Generation X is generally defined as those born after the baby boom ended. Demographers, historians and commentators use beginning birth dates from the early 1960s to the early 1980s The term has also been used in different times and places for a number of different subcultures or countercultures since the 1950s.
  6. Generation Y, also called Millennials, describes the generation following Generation X. There are no precise dates for when the Millennial generation starts and ends. Commentators have used birth dates ranging somewhere from the latter 1970s or from the early 1980s to the early 2000s (decade).
  7. Generation Z is a name used (although other terms exist) for the cohort of people born from the early 2000s to the present day who are distinct from the preceding Millennial Generation. (Wikipedia

Why bother, do the differences matter? Yes, yes they do matter. St. Louis’ first planner was Harland Bartholomew, born in 1889, was part of the Lost Generation where many died in WWI:

Those who came home were profoundly affected by their war experience. Feeling cynical about humanity’s prospects, they rebelled against the values of their elders, seeking debauchery instead of decency, and hedonism instead of ideology. (source)

It was this generation that sought to improve upon cities through massive urban renewal projects and expansive highways though Bartholomew’s New York contemporary Robert Moses (b18888) and President Dwight D. Eisenhauer (b1890), respectively.

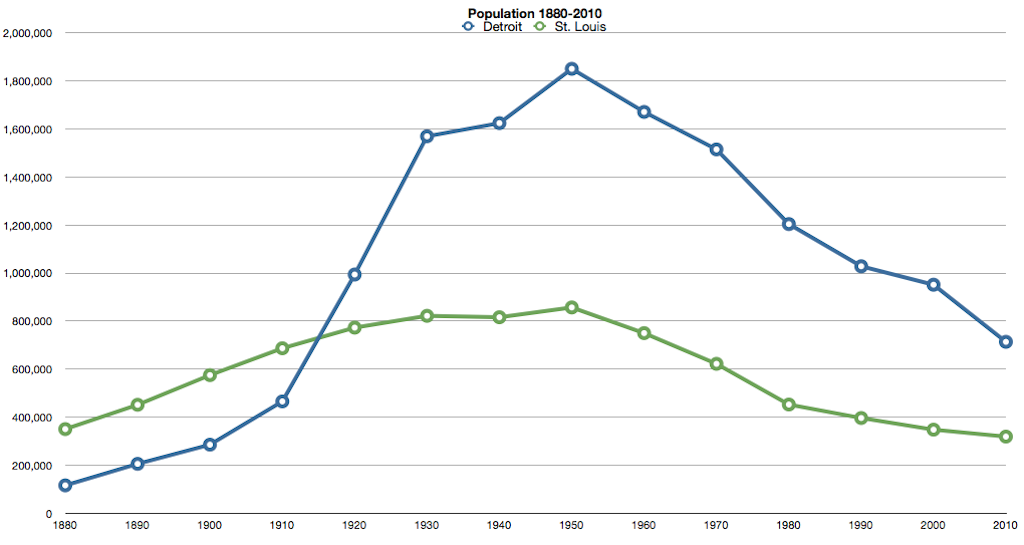
Bartholomew, blinded by his views, missed generational change taking place during his tenure. Despite a drop in population from 1930-1940, the City Plan from 1947 said:

The Plan Commission confidently predicts that by 1970 barely a generation hence-the city proper can have 900,000 population. This would be an increase of only slightly more than 10 per cent since the 1940 census, but such a growth of 84,000 calls for making proper room for the new roofs, adequate traffic ways for the added automobiles, economical plans for all the additional public and semi-public facilities to be required. Furthermore, there must be a catching-up with all the improvements perforce neglected during the long war period. (Comprehensive City Plan 1947)

Bartholomew didn’t see that the middle class of the two generation after his, the Greatest Generation & Silent Generation, were leaving the urban core for the new suburbs. Or he thought that they’d return/stay if we just rebuilt the urban core to emulate suburban development. He was wrong, his generation was in charge at all levels of local, state and federal government.

Just as not all agree on the years for defining a generation, there isn’t agreement on how many people of each generation are with us today.

The Millennial generation, also known as Generation Y or the “Echo Boomers,” is three times bigger than Generation X and even bigger than the Baby Boom generation. The dates of the Millennial generation are not precisely defined, but depending on what measure you use, their birth dates typically stretch from the late 1980 to 2000. (source)

Other sources indicate about 50 million Gen X and 75-80 million Gen Y. What’s not disputed is Gen Y outnumbers the Baby Boomers and both outnumber Gen X.

We’re familiar with talk about how Vietnam permanently shaped the baby boomers. But if you grew up in or near an American city in the 1970s, you grew up with crime (and divorce), and this disorder was bound to leave a permanent mark. It was bound to shape the people, now in their 40s and early-50s, reaching the pinnacles of power.

It has clearly influenced parenting. The people who grew up afraid to go in parks at night now supervise their own children with fanatical attention, even though crime rates have plummeted. It’s as if they’re responding to the sense of menace they felt while young, not the actual conditions of today.

The crime wave killed off the hippie movement. The hippies celebrated disorder, mayhem and the whole Dionysian personal agenda. By the 1970s, the menacing results of that agenda were all around. The crime wave made it hard to think that social problems would be solved strictly by changing the material circumstances. Shiny new public housing blocks replaced rancid old tenements, but in some cases the disorder actually got worse. (NYTimes – Children of the ’70s)

Gen X moved to the suburbs in droves either as kids or young adults. In my case, my parents built a new suburban house while my mom was carrying me. Gen Y largely grew up in suburbia.

One area where generations vary is employment:

Relative to older generations, Gen Y is the most optimistic about the future and is willing to do whatever it takes to build a career, including going back to school, starting a business or moving back in with their parents. Despite a tough jobs market and the strong likelihood that they have student loan debt, 88 percent of millennial job seekers say they are optimistic about finding a new job. After all, they do have their whole working lives ahead of them. The fact that, overall, members of Gen Y are finding work faster than older generations surveyed may also have something to do with their optimism. The jobs millennials are getting may not be ideal — lots in retail and categories that don’t require a college degree — but at least the job hunt isn’t being dragged out forever.

Nearly half of Gen Y has considered going back to school instead of continuing their job search (35% of Gen X and 23% of Boomers), and nearly one-third are being forced to move back in with their parents (31% of Gen Y, 24% of Gen X and 13% of Boomers). One more difference about millennials is that, naturally enough for a generation that came of age with Twitter and Facebook, they’re more likely to use social media in the course of the job hunt. Before interviewing, Gen Y members are more likely to follow and interact with the company’s social media profiles over older generations (24% of Gen Y, vs. 19% of Gen X and 16% of Boomers). (Time.com – How Different Generations of Americans Try to Find Work)

Once hired, Gen Y are very different in the workplace than older workers:

Right now, there are about 80 million millennials and 76 million boomers in America. Half of all millennials are already in the workforce, and millions are added every year. Approximately 10,000 millennials turn 21 every day in America, and by the year 2025, three out of every four workers globally will be Gen Y. “This generation is reshaping today’s consumer and media markets, and even MTV itself,” says Nick Shore, a senior vice president at MTV involved in the “No Collar Workers” study.

Gen Y will also reshape the workplace—sooner than later, if they have their way. Among other characteristics that stand out, millennials, who have come of age with the text message and social media, are an impatient bunch: They’re hyper-connected, tech savvy, entrepreneurial, and collaborative. They also favor fast-paced work environments, want quick promotions, and aren’t fans of traditional office rules and hierarchies. (Time.com – Millennials vs. Baby Boomers: Who Would You Rather Hire?)

Where Gen Y works is different too:

Gen Y workers don’t tend to have jobs inside the biggest U.S. companies, especially if those companies are not in high tech. Most members of Gen Y prefer to work for smaller firms that offer more flexibility and the chance to do social networking at work without strict corporate guidelines. The survey showed that the highest concentration of Gen Y workers, 47%, work for companies with fewer than 100 employees, followed by medium-sized companies with between 100 and 1,500 employees (30%). The fewest, 23%, work in companies with more than 1,500 employees. Of those companies, the top five are all tech firms: Qualcomm, Google, Medtronic, Intel and Microsoft. (Forbes – The Best Cities For Gen Y Jobs)

Considerable attention was paid to housing as Boomers sought suburban housing when they were raising families. Now developers are focusing on housing Gen Y.

Given their large numbers and potential to consume, Generation Y, most of whom are in their 20s and early 30s, are a major focus of real estate investors and developers. Prominent researchers have investigated and analyzed how this generation will consume, live, work and play.

The quote above is from the description of an upcoming ULI (Urban Land Institute) St. Louis event: Generation Y: What Kind of Real Estate Do They Really Want?

Any city or metropolitan region that cannot provide affordable, walkable, and attractive neighborhoods in which gen-Yers can afford to live will simply lose the best of them to those regions that have such neighborhoods. If they have to “drive ’til they qualify,” as the workforce before them has had to do, gen-Yers are more likely to simply fly off to another city or region.

Simply put, generation Y represents the future of every region’s economy. Attracting and keeping this group requires careful planning and a commitment to develop new mixed-income housing in mixed-use neighborhoods close to the central city and to the surrounding suburban town centers. The time to do this is now, while gen-Yers are still living at home, because when jobs for them do come back, the pent-up demand they represent will move quickly to those regions that are ready for them. (ULI – Housing Gen Y: The Next Challenge for Cities)

Boomers and Gen X did the “drive until you qualify” routine to find affordable new housing.  Thankfully Gen Y isn’t interested in driving out from the core to reach affordable housing. In fact, they’re not too interested in driving in general.

From 2001 to 2009, the average annual number of vehicle-miles traveled by people ages 16-34 dropped 23 percent, from 10,300 to 7,900, the survey found. Gen Y-ers, also known as Millennials, tend to ride bicycles, take public transit and rely on virtual media.

More than a quarter of Millennials – 26 percent – lacked a driver’s license in 2010, up 5 percentage points from 2000, the Federal Highway Administration reported. (Reuters – America’s Generation Y not driven to drive)

Cynical Boomers will say this is simply because they’re unemployed or underemployed in large numbers. “Get them jobs and they’ll be driving like we have” is the viewpoint.  This is how older generations misunderstand later generations, failing to see emerging trends early on. In February 2008, pre-recession, a NY Times piece

In the last decade, the proportion of 16-year-olds nationwide who hold driver’s licenses has dropped from nearly half to less than one-third, according to statistics from the Federal Highway Administration.

Reasons vary, including tighter state laws governing when teenagers can drive, higher insurance costs and a shift from school-run driver education to expensive private driving academies.

To that mix, experts also add parents who are willing to chauffeur their children to activities, and pastimes like surfing the Web that keep them indoors and glued to computers. (NY Times – Fewer Youths Jump Behind the Wheel at 16)

Certainly lack of work is part of the reason but so is the fact Gen Y grew up being driven everywhere by their parents.

The cities/regions that understand Gen Y will be able to attract them and the employers that want to hire them. Some of these employers will be run by members of Gen Y. The sheer numbers entering the workforce, moving out of mom & dad’s safe suburban home, and willingness to relocate means a migration is on. Will the St. Louis region capitalize on this by making the entire core (ie: city) the type of walkable place they seek? Right now I’d say no, we won’t capitalize on the chance to retain and attract significant numbers of Gen Y.

– Steve Patterson


St. Louis Population May Drop Below 300K In 2020 Census

We’re still seven years away from the 2020 census but it’s already on my mind. Last month I attended at I attended a lunch where the two speakers talked about Detroit and St. Louis. From the invite:

Detroit’s New Plan for Urban Regeneration and What It Means for St. Louis

Speakers:

Alan Mallach, senior fellow of the National Housing Institute, is the author of many works on housing and planning, including Bringing Buildings Back and Building a Better Urban Future: New Directions for Housing Policies in Weak Market Cities. He served as director of housing and economic development for Trenton, N.J. from 1990 to 1999. He is also a fellow at the Center for Community Progress and the Brookings Institution.

John Gallagher is a veteran journalist and author whose latest book, Reimagining Detroit: Opportunities for Redefining an American City, was named by The Huffington Post as among the best social and political books of 2010. He joined the Detroit Free Press in 1987 to cover urban and economic redevelopment efforts in Detroit and Michigan, a post which he still holds. His other books include Great Architecture of Michigan and, as co-author, AIA Detroit: The American Institute of Architects Guide to Detroit Architecture.

One of the two said Detroit has accepted that it has shrunk and it is likely to shrink more in the 2020 census, that St. Louis is also likely to lose population again — possibly falling below 300,000. The fact is this may well happen.

Detroit's population (blue) increased faster than St. Louis' (green) but it also dropped faster. Click image to see larger view.
Detroit’s population (blue) increased faster than St. Louis’ (green) but it also dropped faster. Click image to see larger view.

Still, others love to dump on St. Louis. For example, a recent opinion piece in the Kansas City Star titled Kansas City is rising as St. Louis keeps falling:

• In 1950, St. Louis was the eighth largest U.S. city, with 857,000 people. But by 2010, St. Louis had lost a stunning 538,000 people and plummeted to the 58th largest city, with only 319,000 residents.

• In 1980, St. Louis was still Missouri’s largest city, barely ahead of Kansas City. But by 2010, Kansas City’s population of 460,000 was 44 percent larger than St. Louis’. 

In response friend Matthew Mourning posted on Facebook:

The 1940 city limits of KC were a 58 square mile box of the Missouri River (N), State Line Rd. (W), Blue River (E), and 79th Street (S). (St. Louis is, and has been since the 1876 divorce, 62 square miles, while present day Kansas City tops out at 315 sq. mi. after a series of annexations).

Those 1940 KC city limits had a population of 400,178. In 2010, the population of the same approximate area was *184,803*. That’s a drop of ~215,000, or nearly 55%. St. Louis’s core loss was around 62% since 1940. – Matthew Mourning via Facebook

The point is to look at what’s happening in the core, not including ring after ring of low-density sprawl. Our fixed city limits is the regional core whereas cities like Kansas City and Oklahoma City were able to annex as population fled their core.

St. Louis' population density (persons/sq mile) is on par with Detroit & Cleveland and higher than Portland OR.
St. Louis’ population density (persons/sq mile) is on par with Detroit & Cleveland and higher than Portland OR.

Kansas City is denser than Oklahoma City, but that’s not saying much. St. Louis, Detroit, & Cleveland being denser than the acclaimed Portland OR is huge. But numbers themselves can be deceiving, Portland has very dense central neighborhoods. It’s very walkable & cyclist friendly.

In the 2010 census our tracks that had investment in becoming more urban (downtown, near north & south) saw increases in population, while north & south St. Louis continued to lose population. Wake up St. Louis, we need to make the entire City of St. Louis urban/walkable/bikeable. Not in a half-ass way either, the whole deal with transit, strong pedestrian plan, modern zoning.

Auto-centric monstrosities like Loughborough Commons can’t keep happening if we expect to stop the loss of population. But I don’t see any willingness or leadership to prioritize urbanizing more than a few pieces here and there, fragmented in true St. Louis fashion.

If we stay on our current course I wouldn’t be surprised if we drop below 300,000 when the 2020 census comes out in 2021.


Advertisement


[custom-facebook-feed]

Archives

Categories

Advertisement


Subscribe