Five years ago I suggested 9th & 10th Streets through the Columbus Square neighborhood (Cole to Cass) be uncoupled so that both are two-way streets again. See Columbus Square: 9th & 10th Streets from May 19, 2014.
In short, 9th & 10th have been a one-way couplet (opposite directions) to facilitate vehicular travel between I-70 and downtown — passing through the Columbus Square neighborhood. Due to the construction of the Stan Musial Veterans Memorial Bridge 9th/10th hasn’t connected to I-70 in 8-9 years. Yet, these excessively wide one-way streets remain through the neighborhood.
What has changed in the last five years?
I moved to the neighborhood nearly 5 months ago and 9th Street immediately south of Cole Street will close if the convention center is expanded. Living here, frequently crossing 9th & 10th, I can tell you they’re substantially wider than necessary. Being wide and one-way their design encourages drivers to travel at much higher speeds than should be in a residential neighborhood.
Five years ago the main obstacle to correcting this problem was the cost to alter/replace 3 traffic signals. The possible convention center expansion project includes significant changes to Cole Street — including new signals at 9th & 10th. That leaves only the relatively new signal at 9th & Cass to modify — minor work since 3 out of 4 approaches is currently two-way. Some additional stop signs will be necessary at intersections between Cole & Cass.
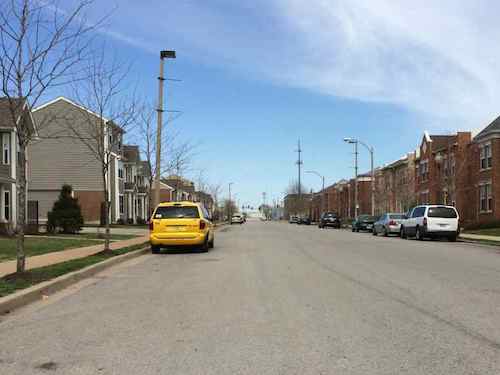
Looking North on 9th Street toward Cass. It’s 44 feet from curb to curb.
We measured the width of 9th & 10th in various places five years ago, 9th @ Manhattan Place (south of Cass) was a very wide 44 feet. For comparison, Locust at 16th is a much busier street and is 42 feet wide. You need 8 feet for each parking lane, plus a max of 12 feet for each travel lane — a total of 40 feet. I’d prefer 10 or 11 foot travel lanes. There’s no money to physically narrow the streets, but a wide center “median” could be painted with stripes.
This pair of streets should’ve been returned to two-way during the 2010-2013 bridge project, but they weren’t. With the convention center project closing 9th and altering Cole, we’ve got another opportunity to correct the problem of one-way highway access streets through the center of a neighborhood — with an elementary school in between.
Top o’ the mornin’ to ya. I knew the recent non-scientific Sunday Poll was going to have a low response, the more controversial the subject, the more responses.
Q: Agree or disagree: Irishman Saint Patrick is celebrated today for bringing Christianity to Ireland, driving out snakes.
Strongly agree: 1 [6.67%]
Agree: 3 [20%]
Somewhat agree: 1 [6.67%]
Neither agree or disagree: 0 [0%]
Somewhat disagree: 0 [0%]
Disagree: 2 [13.33%]
Strongly disagree: 6 [40%]
Unsure/No Answer: 2 [13.33%]
Most correctly disagreed. I say correct because everything stated in the poll question was false:
Patrick wasn’t Irish
Christianity was already in Ireland before Patrick
Ireland, an island, didn’t have an literal snakes
This reminds me of grade school in the early 70s, cutting shamrocks out of green construction paper, etc. We were taught myths that just aren’t accurate — including the color green!
Myth: St. Patrick was Irish. Though one of Ireland’s patron saints, Patrick was born in what is now England, Scotland or Wales—interpretations vary widely—to a Christian deacon and his wife, probably around the year 390. According to the traditional narrative, at 16 he was enslaved by Irish raiders who attacked his home; they transported him to Ireland and held him captive there for six years. Patrick later fled to England, where he received religious instruction before returning to Ireland to serve as a missionary.
Myth: St. Patrick was British.
Myth: St. Patrick brought Christianity to Ireland.
Myth: St. Patrick banished snakes from the Emerald Isle.
Myth: Green has historically been associated with St. Patrick’s Day.
Myth: Popular St. Patrick’s Day festivities have their roots in Ireland.
Myth: Corned beef is a classic St. Patrick’s Day dish.
You can click the link above to read the debunking of each myth.
Irish-American immigrants celebrated St. Patrick’s Day as a show of their pride — despite lots of anti-Irish discrimination:
The refugees seeking haven in America were poor and disease-ridden. They threatened to take jobs away from Americans and strain welfare budgets. They practiced an alien religion and pledged allegiance to a foreign leader. They were bringing with them crime. They were accused of being rapists. And, worst of all, these undesirables were Irish. (history.com)
Sounds similar today’s anti-immigration rhetoric.
The money to build the Mullaphy Emigrant Home on N 13th was left by Bryan Mullanphy, the son of Irish immigrant John Mullanphy. Bryan Mullanphy was mayor in the 1840s.
Bryan’s sister Anne Mullanphy married Thomas Biddle. After his death she donated the land for St. Joseph’s church in what’s now known as the Columbus Square neighborhood. Most Irish immigrants were poor living in tenements & flats stretching west to Jefferson, including what became known as the former [Kerry] Patch neighborhood:
The neighborhood’s boundaries shifted over time—Irish families moved farther west, as German, Polish, and Eastern European immigrants settled around them after the Civil War. But during its heyday, the Patch was generally described as being between N. 15th Street and Hogan Street, Division Street and Cass Avenue. The heart of the neighborhood was squeezed into the tight rectangle between 16th and 18th streets, Cass Avenue and O’Fallon Street—a few blocks east of St. Stanislaus Kostka Church in near north St. Louis.
In the early 19th century, emigrants left Ireland to escape English political oppression. By 1847, during the height of An Gorta Mór, The Great Hunger, they flooded out of the country to escape starvation and death. As Diamond notes, the immigrants’ sheer numbers, as well as their religious affiliation—Catholic—did not endear them to second- and third-generation American Protestants, specifically the nativist Know Nothing movement, founded in 1845, the year the potato famine began. The level of disdain and outright hostility toward Irish immigrants in major American cities, including St. Louis, was reflected in ads for housekeepers, which indicated “NO IRISH NEED APPLY.” Earlier Irish immigrants who had blended into St. Louis society also castigated the new arrivals for not working hard enough to assimilate, Diamond adds. Patchers responded by banding together. (St. Louis Magazine)
Once Irish neighborhoods were razed for public housing projects: Cochran Gardens, Carr Square, and Pruitt-Igoe.
The recent non-scientific Sunday Poll was about closed streets and crime, prompted by a news story about new research at Saint Louis University:
St. Louis’ often-interrupted street grid is the outgrowth of the 1970s-era “defensible space” strategy to address rising crime championed by Oscar Newman, a prominent urban planner who was a Washington University architecture professor in the mid-1960s, according to the paper. That idea stems from the notion that an area is safer when residents feel a sense of ownership and control, which Newman described as allowing neighbors to focus their attention on “removing criminal activity from their communities.”
St. Louis became the birthplace of such ideas, according to the paper. And they haven’t had the desired effect. (Post-Dispatch)
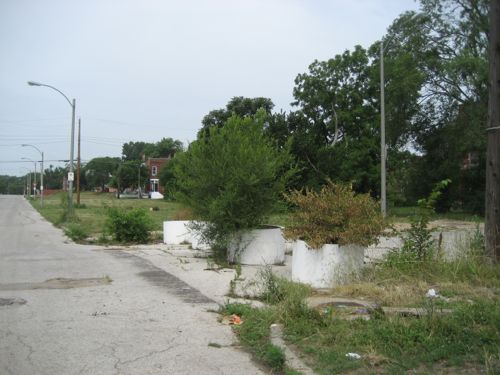
Below is one such example where “Schoemehl pots”, just sections of sewer pipe, were used to limit vehicular traffic.
Schoemehl pots used in their traditional role of messing up the street grid, 2012 photo.
Their paper’s conclusion:
Oscar Newman’s defensible space theory is a product of St. Louis’s mid-century history. It is perhaps unsurprising, therefore, that St. Louis also offers a large-scale implementation of defensible space in the street barriers that constrict swaths of the city’s geography. The barriers scattered across the city’s landscape are a testament not only to former Mayor Vincent Schoemehl, the elected official most closely associated with the barriers, but to Newman himself. We have developed the most comprehensive known list of closures in the city, and find that the density of closures is not associated with less crime in neighborhoods. Our finding is an important one for St. Louis, given that addressing crime is the argument being made explicitly in the legislation that authorizes more recent installations of barriers. For other municipalities that may be considering defensible space or other techniques to “design out” crime, our findings suggest that street closures are at best ineffective and at worst associated with higher rates of violent crime in neighborhoods. They may also have secondary effects on first responders’ ability to reach the neighborhoods they serve. (Research paper)
I completely agree with the conclusions of the researchers, but I also think they should be looking at earlier changes to the urban street grid. As I’ve said before, when Harold Bartholomew (1889-1989) first arrived in St. Louis in the nineteen teens he quickly began assaulting our fine network of public streets. Writing decades later in the 1947 plan:
Since 1916 St. Louis has expended over $40,000,000 in opening, widening, connecting, and extending the system of major streets. Much has been accomplished in converting a horse and buggy street system to automobile needs. As the total volume of traffic increases, however, certain new needs arise. An example is the desirability of grade separations at extremely heavy intersections, such as at Grand and Market and at Kingshighway and Lindell. Likewise there is a need for complete separation of grade where traffic volume is sufficiently heavy to justify the cost involved. The Federal Government, which has helped finance our splendid system of national highways, has recently revised its policies and Congress has appropriated substantial funds to aid the cities in the construction of express highways and for facilitation of traffic flows from certain selected state highways through metropolitan areas to the central business districts of large cities. (1947 Plan)
In just three decades St. Louis spent today’s equivalent of nearly a half a billion dollars on dramatic changes to the street grid. Half a billion!
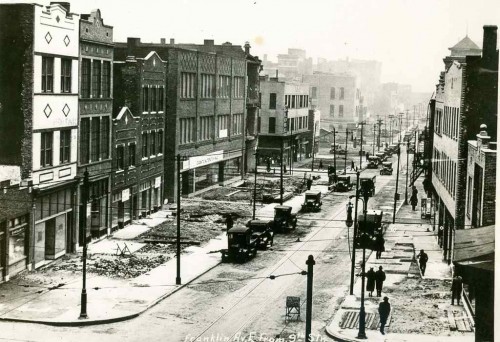
Franklin Ave looking East from 9th, 1928. Collection of the Landmarks Association of St Louis
The reference to the “horse and buggy street system” illustrates he didn’t think it was suitable for the automobile. Bartholomew, a civil engineer by training, was no doubt influenced by the City Beautiful movement.
City Beautiful movement, American urban-planning movement led by architects, landscape architects, and reformers that flourished between the 1890s and the 1920s. The idea of organized comprehensive urban planning arose in the United States from the City Beautiful movement, which claimed that design could not be separated from social issues and should encourage civic pride and engagement. (Britannica)
This was soon followed by the modernists and their vision for roads to connect everything. The Futurama exhibit at the 1939 World’s Fair was hugely popular, helped shape legislation that let to destructive urban renewal projects, interstate highways slicing through cities, etc. See original 23-minute 1939 Futurama promo video.
Oscar Newman was born in 1935, so he was barely around during the 1939 fair. With the Great Depression & WWII the ideas from Futurama were on hold until he was a teen. Newman likely went along with most others, not foreseeing any problems with additional alterations to the street grid.
By the time republished his 1972 book urban renewal & highway projects had further disrupted the street grid beyond recognition. These changes are cumulative, not isolated. Our street grid was designed for the horse and buggy times — but that’s what made it go great. Street grids can take little changes and still function. St. Louis had decades of massive overwhelming changes to the street grid.
It has proven to be excessive. Abandonment, crime, etc are the results. I don’t know that it’s repairable.
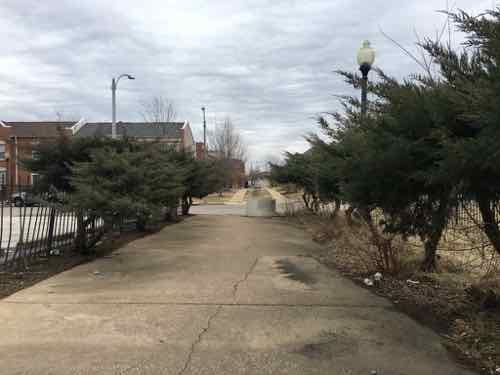
Former Biddle Street, looking East toward 9th Street
The results from Sunday’s non-scientific poll:
Q: Agree or disagree: City streets closed to through traffic reduce crime.
Strongly agree: 1 [3.13%]
Agree: 2 [6.25%]
Somewhat agree: 6 [18.75%]
Neither agree or disagree: 2 [6.25%]
Somewhat disagree: 2 [6.25%]
Disagree: 9 [28.13%]
Strongly disagree: 9 [28.13%]
Unsure/No Answer: 1 [3.13%]
More than half correct don’t think closed streets reduce crime.
February 22, 2019Featured, TransportationComments Off on My Ridesharing Experience As A Driver
My first time mentioning ride sharing companies Lyft & Uber on this blog was in a May 2014 poll. This was largely due to the fact I’d never used either. In January 2018 that changed when it was just too cold for me to take my wheelchair/transit to a doctor’s appointment. That cold January day I tried Lyft for the very first time. After a good experience both directions I decided I’d sign up as a driver.
My husband has our car most of the time while he’s at work, but there are times I have the car — at least access to it. After my first trip as a driver I also signed up to drive for the better-known Uber. I then got my husband to sign up for both, he could do it on the way home if he finished with a client early.
Though I’m technically still a driver for both, I haven’t done so since March 2018. Couple of reasons why. First, we bought a newer car that was larger and more high tech than I’d been used to. When driving it initially I needed to get used to it without any distractions. Second, my vision was getting so bad that I often couldn’t see to drive when the car was available due to glare from the sun.
Earlier this week I completed and filed our 2018 taxes, so I’ve recently downloaded and reviewed our summary reports. I gave a grand total of 8 rides in about a 10 week period, 3 via Lyft and 5 via Uber. Most drivers, including my husband, will have both Lyft & Uber on simultaneously until they get a ride, immediately shutting down the other. I could never bring myself to do that. The mental stress of just one app open was enough for me.
Still, it was a great experience. I met some nice people, both locals and tourists. I got to experience the ride sharing industry from within, albeit limited. One was my eight was perfect. I was driving to ALDI to go grocery shopping. I picked up a guy at Firestone and took him to his house, which was on the way to the ALDI I wanted to visit. In 2018 my husband had a total of 177 trips; 58 with Lyft & 119 with Uber.
Back to taxes, both apps track the miles driven while on trips. This is used for tax purposes to account for vehicle expenses (fuel, wear & tear, insurance, maintenance, depreciation, etc). Though we both came out ahead, it wasn’t as much as I’d hoped it would be. We’re going to contribute to the high turnover among Lyft/Uber drivers.
My conclusion on my first time using ride sharing is the same as it is today — this is expensive way to get around. My guess is that it’s on par with a taxicab, but that’s just a guess. Both are far pricier than transit.
In the last few years there have been a ton of articles about how ride sharing reduces car trips…or increases them. How it cannibalizes transit systems…or compliments them. I recently even saw an article about college kids taking Lyft/Uber instead of walking across campus. Compared to a taxicab I do prefer ride sharing — no pressure from the driver to pay with cash instead of plastic.
I’ll keep watching the ride sharing industry and how it is potentially disrupting others, I like that I’ve got experience as a rider & driver.
February 13, 2019Featured, TransportationComments Off on No Surprise, Readers’ Top Transportation Choice is a Private Car
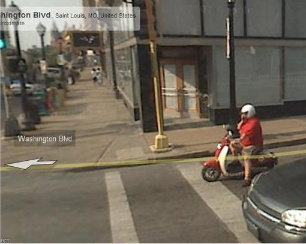
In February 2009 a couple of friends noticed me on Google’s Street View, this would’ve been prior to 2/1/2008.
When I decided on the topic of the recent non-scientific poll, I’d planned to write more along with the results. However, the cold I had last weekend in Chicago continues.
Q: My primary mode of transportation is… (pick up to 3):
Private vehicle, paid off (no loan/lease): 12 [25%]
Private vehicle, outstanding loan: 11 [22.92%]
Pedestrian, able-bodied: 9 [18.75%]
Bicycling, my own bike: 5 [10.42%]
Public transportation, bus/rail (use weekly/monthly pass): 4 [8.33%]
TIE: 2 [4.17%]
Car sharing: Lyft, Uber, etc
Public transportation, bus/rail (pay cash)
TIE: 1 [2.08%]
Pedestrian, uses a mobility device (cane, walker, scooter, wheelchair, etc)
Motor scooter
Car sharing: Taxicab
TIE — zero responses
Bicycling, a bike share bike
E-Scooter, owned
E-Scooter, sharing like Bird Scooters
Motorcycle
Private vehicle, borrowed
Private vehicle, leased
My three choices were pedestrian (with mobility device), public transit (cash), and a private car with a loan balance. I only drive once or maybe twice a week, usually for weekend shopping trips. Most days when I leave home I’m a pedestrian in my power wheelchair, but I combine with transit when I need to go further.
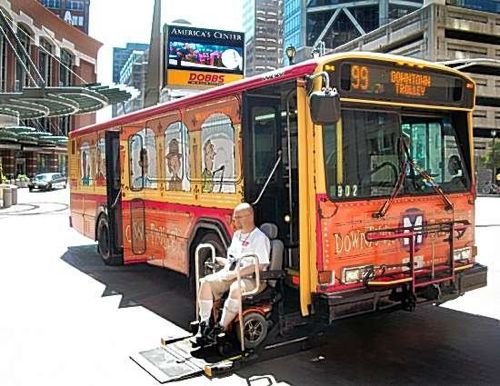
Me exiting the Downtown Trolley on the day it debuted in July 2010. The bright graphics are no longer used. Photo by Jim Merkel, Suburban Journals
I like that the top poll answer was cars that were paid off, that would’ve been one of my answers a year ago. OK, time for bed.
AARP Livibility Index
The Livability Index scores neighborhoods and communities across the U.S. for the services and amenities that impact your life the most
Built St. Louis
historic architecture of St. Louis, Missouri – mourning the losses, celebrating the survivors.
Geo St. Louis
a guide to geospatial data about the City of St. Louis

 My husband has our car most of the time while he’s at work, but there are times I have the car — at least access to it. After my first trip as a driver I also signed up to drive for the better-known Uber. I then got my husband to sign up for both, he could do it on the way home if he finished with a client early.