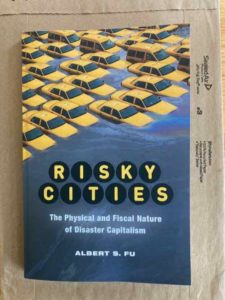
April 7, 2022Books, Environment, FeaturedComments Off on New Book — ‘Risky Cities: The Physical and Fiscal Nature of Disaster Capitalism’ by Albert
A new book explores one of my favorite topics: the overlap of urbanization, capitalism, and disasters. Think our bad habit of developing in flood plains, then acting shocked when levees results in flooding elsewhere. The term “disaster capitalism” is very appropriate.
Over half the world’s population lives in urban regions, and increasingly disasters are of great concern to city dwellers, policymakers, and builders. However, disaster risk is also of great interest to corporations, financiers, and investors. Risky Cities is a critical examination of global urban development, capitalism, and its relationship with environmental hazards. It is about how cities live and profit from the threat of sinkholes, garbage, and fire. Risky Cities is not simply about post-catastrophe profiteering. This book focuses on the way in which disaster capitalism has figured out ways to commodify environmental bads and manage risks. Notably, capitalist city-building results in the physical transformation of nature. This necessitates risk management strategies –such as insurance, environmental assessments, and technocratic mitigation plans. As such capitalists redistribute risk relying on short-term fixes to disaster risk rather than address long-term vulnerabilities. (Rutgers University Press)
March 3, 2022Environment, FeaturedComments Off on We Saved 17.3% On Last Month’s Electric Bill
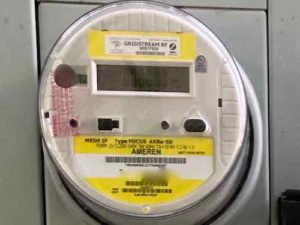
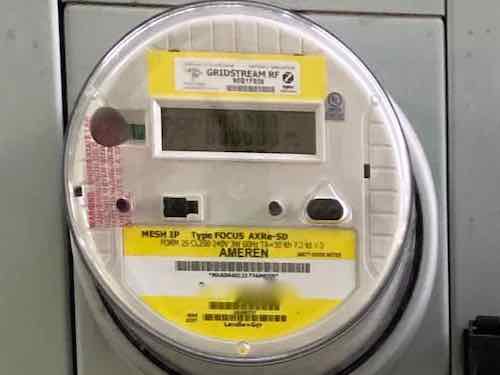
A smart electric meter is needed for Time of Use (TOU) rate plans.
Many more of you now have a smart electric meter, assuming you’re an Ameren Missouri customer, than when I have previously posted about this new technology — and the variety of billing rates that go along with it.
We have now completed 8 billing cycles using new time of use (TOU) billing rates — the rate charges varies depending upon the time of day. We did one month of Evening/Morning Savers, four months of Ultimate Savers, and the last three on the Smart Savers plan. The latter plan is best for us, more on that below.
You’re probably thinking you don’t want to mess with new rate plans, you’ll just stick with the flat rate (aka Anytime Users) you’ve always had. Sorry, if you have a new smart meter Ameren will automatically move you to the Evening/Morning Savers plan. This plan charges slightly less for electricity used between 9pm and 9am.
Why is Ameren Missouri changing all meters and complicating electrical rates? They’re trying to minimize energy use during peak demand periods. Think about shopping malls, they have massive amounts of unused surface parking — except for peak periods like Black Friday when parking lots fill up. Surface parking, unfortunately, is cheap so building extra capacity that isn’t used most of the time is no big deal. Energy plants, on the other hand, are incredibly expensive. Plus, Ameren is planning to shut down its second largest coal plant later this year.
Ideal for energy unities (natural gas & electric) the demand would be perfectly flat 24/7/365. Reality is our air conditioning, electric heat, electric clothes dryers, lighting, and electric cooking use isn’t flat. Most people have similar enough schedules they cool off the house after work in summer, make meals at the same time, etc. These activities cause spikes in demand. Roller coaster use isn’t a good match for electricity generation.
Spikes in energy demand are costly to deal with, so it’s better for electric utilities to reward customers to help flatten out demand. So peak times cost more, off peak less. Peak demand happens at different times of the day in winter months compared to summer months.
All four of Ameren’s TOU rate plans have a few common elements.
Summer rates are valid for 4 months, June-September. Thus, winter rates are the remaining 8 months, October-May. The flat rate we’ve all had for years has been different in summer vs winter — higher in summer because of air conditioning demand. What’s new is the variability based on the time of day, and day of week.
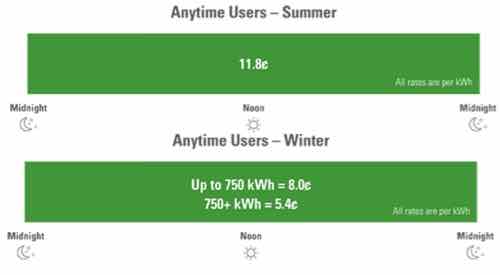
Let’s review the plans, starting with the flat rate we’ve all had for years — the same rate no matter the time of day or the day of the week.
The specific charge per kWh has changed over the decades, but you see the time of day doesn’t matter.
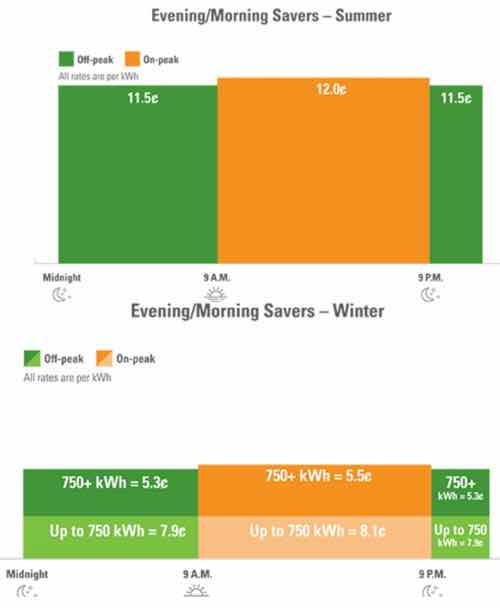
Now we can get into the new plans, starting with the one Ameren has moved you to after installing the smart meter:
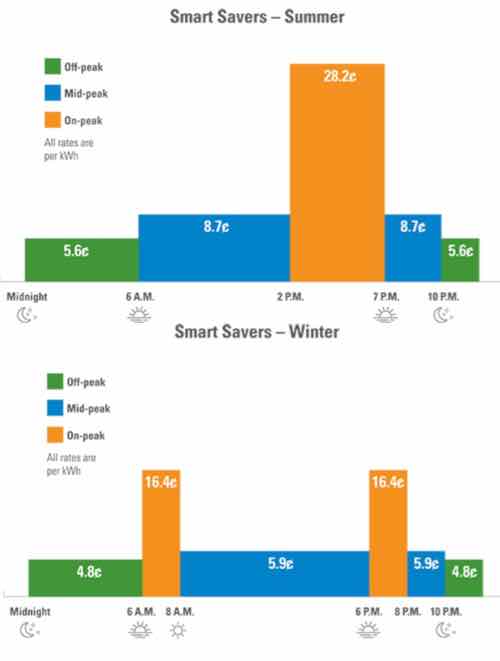
This is the plan everyone will be moved to after receiving a new smart meter. As you can see the rate for 9am to 9pm is only slightly higher than the other half of a 24 hour cycle. 12 hours peak, 12 hours off peak — 7 days a week.
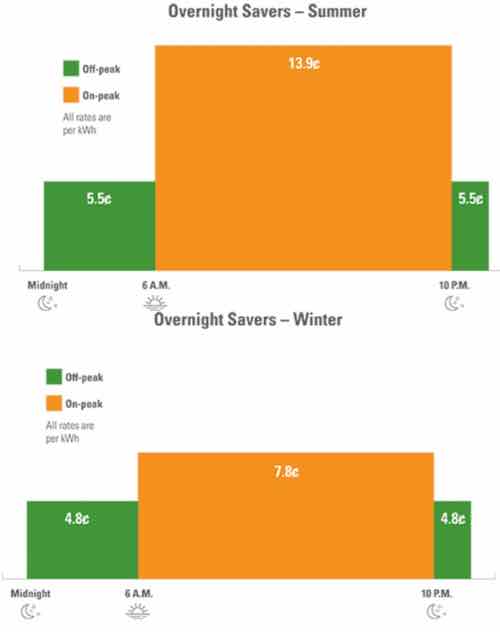
Here are the other three rate plans. They can be confusing but after 4 months Ameren can show you the average cost of each plan based on your usage.
With this plan peak rates are 16 hours, off peak is 8 hours. Seven days a week.
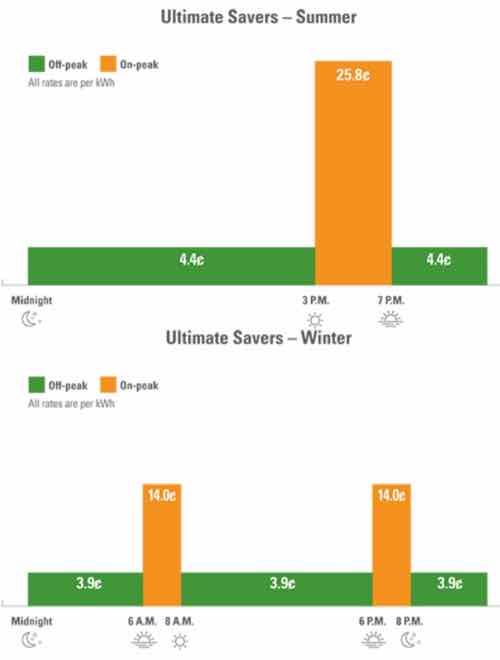
This is the one plan that has three levels, instead of just two. Eight hours of off peak, five hours peak summer, four hours peak winter. Peak is only for non-holiday weekdays.This rate plan has the best rates, but it also has a demand charge based on the hour of highest demand during the billing cycle.
I should note here that major holidays are a break from peak rates, see my first post on TOU rates for specifics.
I jumped into plans as soon as I could, without waiting 4 months to see which plan was best for us. However, I’ve also changed when we use electricity because of these rates — trying to maximize our savings each month. When our report was available I could clearly see the Smart Savers rate plan would save us over the Ultimate Savers plan. I switched based on the report and now that we’re in winter and using electric heating we’re saving big money each month.
We recently received our February bill for the period 1/22/22-2/22/22 — a savings of $12.39 compared to the old Anytime flat rate. The previous cycle we saved $10.64. So far we’ve cumulatively saved $29.22 on time of use rates compared to the old flat rate — nearly 80% of that amount in just the last two billing cycles! I can’t wait to see the savings after we’ve been on our current TOU rate plan for a full 12 billing cycles. Ameren doesn’t tell you the savings, but I’m a spreadsheet geek so I don’t have to do the math manually.
Our apartment is 100% electric, about 15 years old, 3 exterior walls, with two occupied apartments above ours — winter heat is a bigger expense than summer cooling. The best plan for you may be different, all you need to do is log into your Ameren account online to see the approximate average cost per month for each of the time of use billing rates.
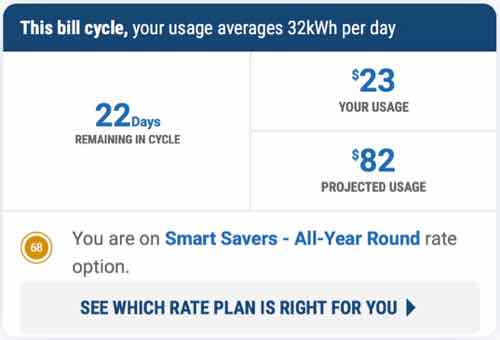
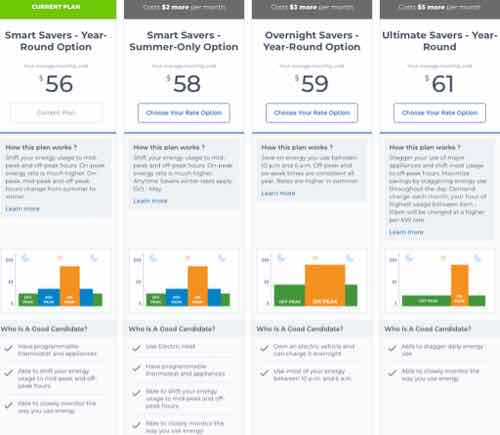
If you have a smart meter and they’ve compared the various TOU rates you’ll see a mention at the bottom of this section of your Ameren dashboard about rates.This is our current comparison. Note the dollar amounts are energy only — no fees, charges, taxes. Some plans you can opt for summer only or all year.
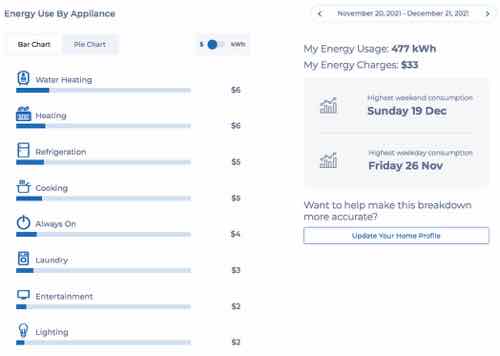
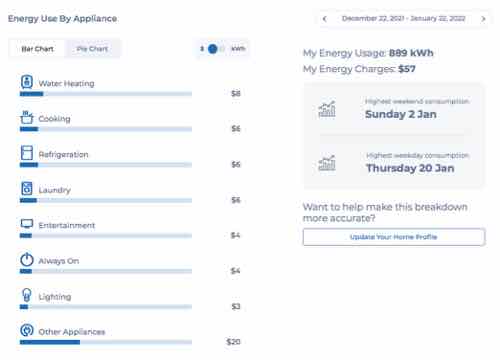
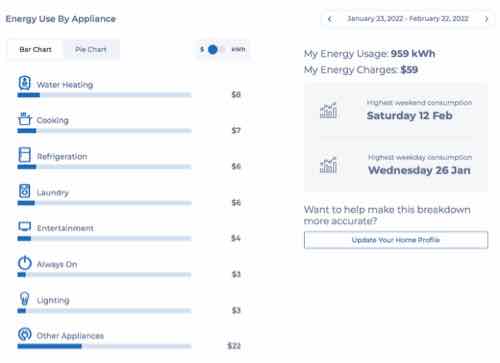
And finally, what makes these new electric meters so smart? They’re able to understand what is using electricity based on the loads. This allows Ameren to show me reports like these:
Our energy use by appliance report, December 2021 bill cycle. Water heating was our biggest single user of electricity in this cycle ahead of heat.In our January 2022 bill energy use by appliance report heating is no longer a separate lime item, this is likely due to our cat’s heating pad that’s on 10pm-6am daily, with the help of a smart plug.Last month our energy use by appliance report was nearly identical to the previous.
Once you have a login for your account it only takes a minute to see if they’ve had enough data from your use to compare rates. You might be paying more each month than necessary.
I mentioned that I did make changes in an effort to reduce our energy costs. I used to do 3 loads of laundry per week, in the mornings. I now do 2 loads timed so the dryer isn’t turned on until 10pm. The washer is set to tap cold water. Most of the time our dishwasher is also run after 10pm — the heat dry and other energy sucking features are off. The dishwasher is occasionally run during the mid-peak time, but never during full peak. Our thermostat is set to a temperature during peak hours so our heat/cooling won’t kick on. I’ve not made any changes to what, how, or when we cook.
In addition to saving money by using some appliances during off-peak hours, we’re using less electricity. Here’s the totals for the last 3 years:
2019: 10,179 kWh
2020: 9,620 kWh
2021: 7,447 kWh
The weather, of course, plays a role in our heating & cooling costs.
Without changing your life you can potentially save money by checking out Ameren’s advanced time of use billing rates — let them show you the comparison. If you’ve only just received your smart meter check bask online each month to see if they have a comparison ready. If you can additionally reduce energy use during peak hours you can save even more.
Earlier this month I attended the 2-day media preview of the Chicago Auto Show. I’ve attended the show every year since 2014, except last year when the usual February show was rescheduled to the summer because of the pandemic. This year’s show was smaller than previous years, but there was still a lot to see.
Some terms you’ll see in this post:
BEV = battery electric vehicle
FCEV = fuel cell electric vehicle
Frunk = front trunk
HEV= hybrid electric vehicle
ICE = internal combustion engine (i.e: a gasoline engine)
MPGe = miles per gallon equivalent
PHEV = plug-in hybrid electric vehicle
Unibody = body & chassis are designed and built together, different than body on frame
In the past years you’d see a number of HEVs and the occasional BEV, but in 2022 the BEVs were everywhere. Most vehicles on display were ICE vehicles, but it was the electric vehicles that were the center of attention at most displays. Only manufacturers that have a dealership network are part of this and other big car shows; so no Telsa, Rivian, Lucid, etc.
Ford
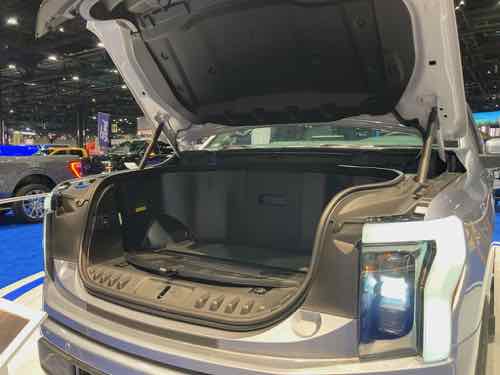
Ford F-150 Lightening BEV: Like the ICE F-150, the electric version is big. Other than a light bar front & rear it looks like any other new pickup. Ford intentionally kept the truck looking similar to other F-150s, a smart move considering the F-series is the best selling vehicle in America.
Ford F-150 Lightening BEVFord F-150 Lightening “frunk”
1978 Ford F-100 Eluminator BEV: I was very excited to see this truck. It was converted to a BEV using Ford’s BEV crate motor, first shown at the ’22 CES (Consumer Electronics Show).
1978 Ford F-100 Eluminator BEV
Ford Mustang Mach-E BEV: I’ve seen a couple on the streets in St. Louis, and a friend’s husband got one. I got to ride in one on the test track, which included a too fast launch control demonstration. I asked if they could demonstrate regenerative braking to stop the car but they said no.
Ford Mustang Mach-E BEV
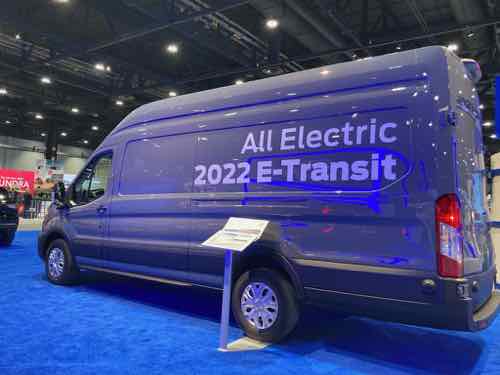
Ford E-Transit BEV delivery van: Delivery & work vans are a big market and they’re good candidates for electric vs ICE since they’re not driven long distances.
Ford E-Transit BEV delivery van
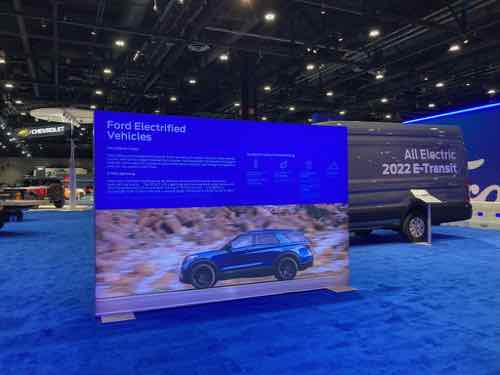
In addition to vehicles, a lot of displays talked about their electrified vehicles.
Ford electrified vehicles display
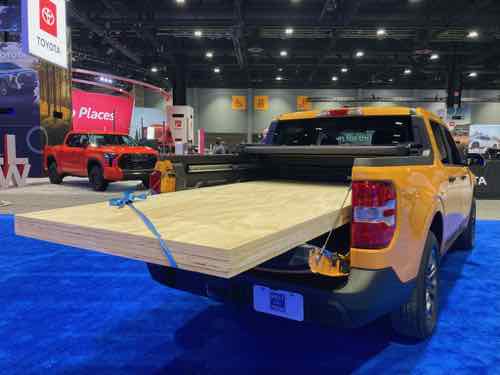
Ford Maverick HEV compact pickup: Ford’s new unibody compact pickup was one of my favorite vehicles at the show, though it’s still larger than the smallest pickups of the 1970s. The base powertrain is hybrid, but a larger non-hybrid ICE is optional. Truck purists aren’t a fan of unibody trucks, others include the Honda Ridgeline and the new Hyundai Santa Cruz.
Ford Maverick HEV compact pickupFord Maverick HEV compact pickup
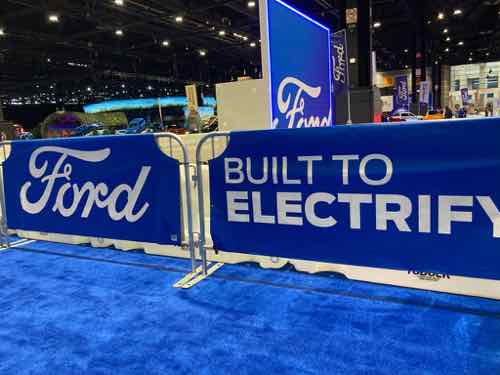
To complete Ford’s electric marketing this banner was displayed on their test track.
Ford “Built to Electrify” banner on their test track
GENERAL MOTORS
General Motors is working toward being a leader in BEVs, but they had little to offer — make that nothing small, only big trucks.
Recently the EPA numbers on the GMC Hummer became public — this is now the least efficient BEV you can buy, only 47 MPGe! Seems appropriate. We need a BEV equivalent term for a gas guzzler, electron hog?
TOYOTA
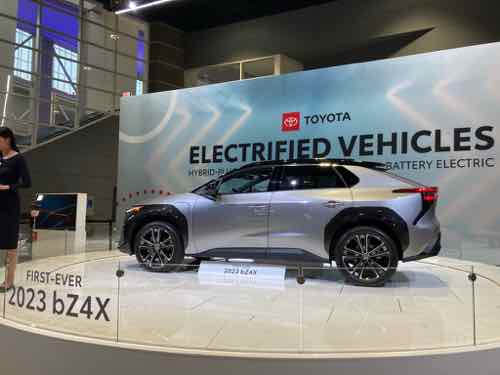
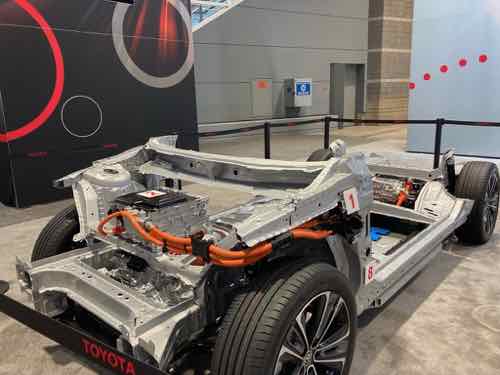
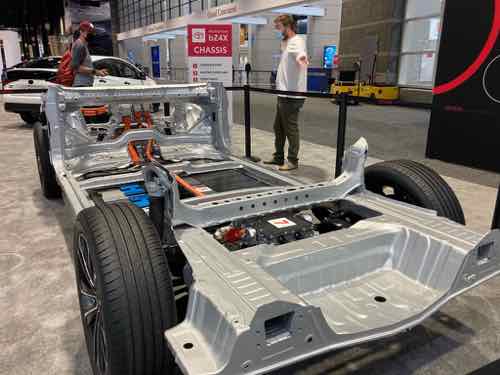
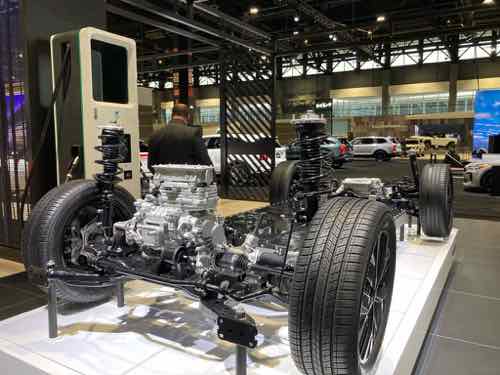
Toyota, with the Prius HEV, has been into electrified vehicles for decades. They’ve made some BEV versions of their RAV4 compact crossover, but they showed their first BEV on a new non-ICE platform.
Toyota’s very first BEV, the bZ4X. Seriously, that’s the vehicle name.Toyota bZ4X BEVbZ4X platformbZ4X platform
SUBARU
Subaru had a very large, interesting display. The premium spot was for their first BEV, the Solterra. Toyota and Subaru worked together to create the new BEV platform shared by the bZ4X (above) and the Solterra.
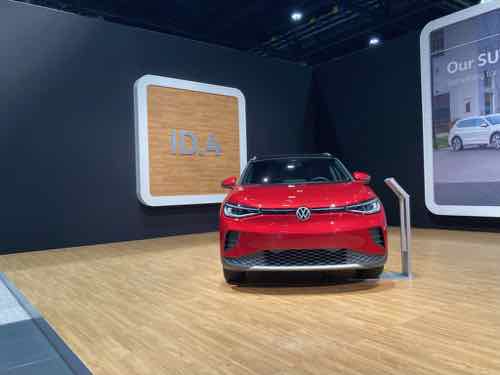
Following the costly dieselgate scandal on many Volkswagen Group vehicles, they had to pivot to electric vehicles. The ID.4 is the first such VW here in the United States.
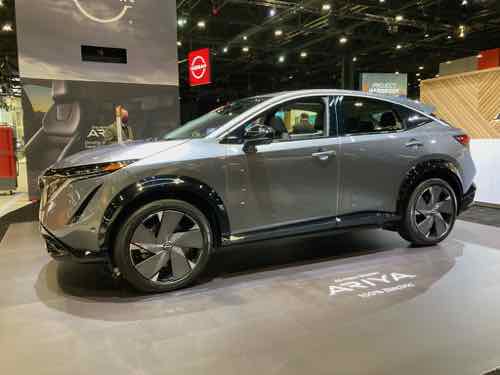
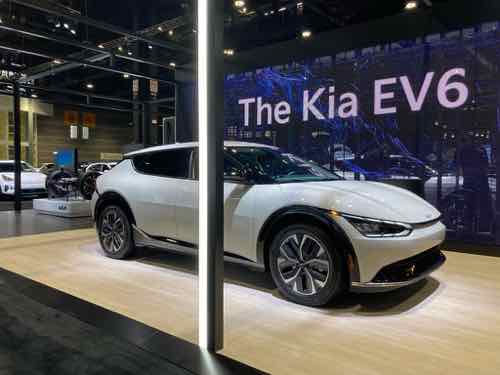
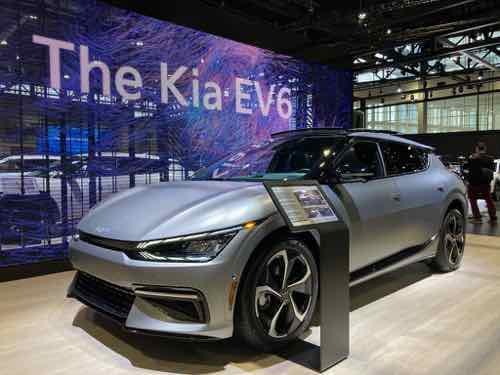
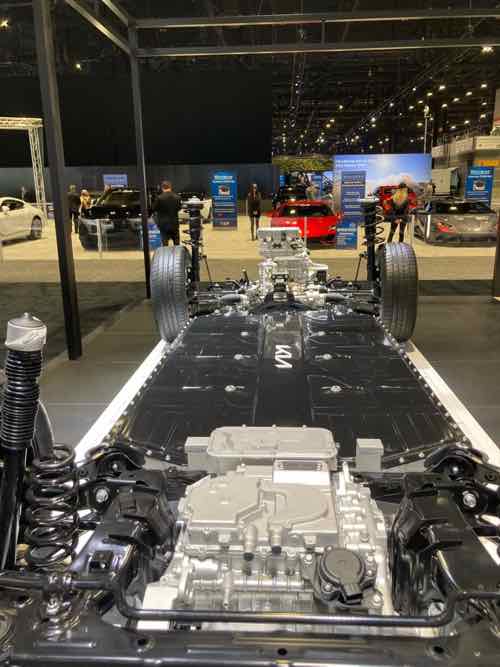
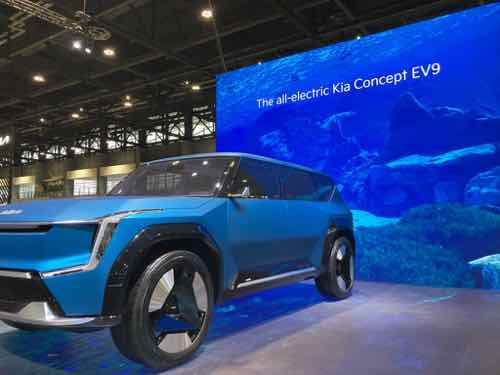
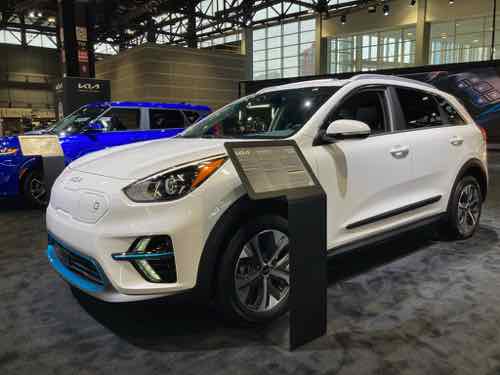
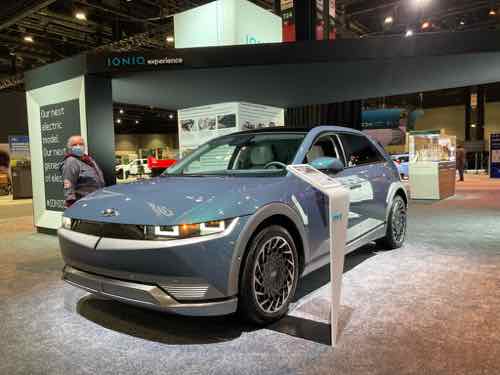
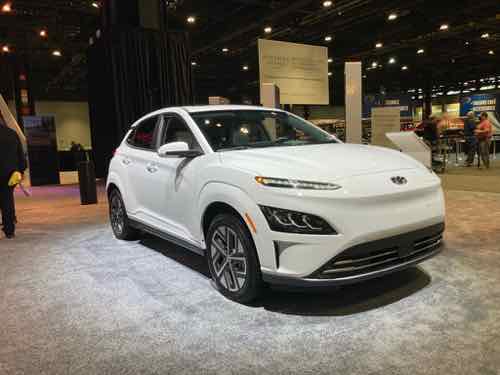
Hyundai has 3 car brands: Kia, Genesis, and Hyundai. All three have a new BEV on a new platform, shown above in the Kia section. Genesis wasn’t at this show, so I didn’t get to see the GV60 BEV. Hyundai has used the Ionic name for a few years, on a vehicle available as a HEV, PHEV, or BEV — depending upon market. Now the Ionic name is being used as a sub-brand. The Ionic 5 BEV crossover is the first of their trio of new BEVs to market.
Hyundai Ionic 5 BEVHyundai Ionic 5 BEVHyundai Ionic 5 BEV interiorHyundai Nexo FCEVHyundai Kona PHEV or BEV
CLOSING THOUGHTS
It was great seeing so many BEVs in one place, like it or not vehicles are quickly switching from internal combustion to battery electric.
I wish more emphasis was placed on efficiency, rather than just 0-60 time or total range. In reviewing MPGe numbers on FuelEconomy.gov I can see none of the world’s legacy auto manufacturers can beat the efficiency of Tesla & Lucid. Chevy & Kia do have models in the top 10 in efficiency.
Think of it like an efficient car with a small fuel tank going the same distance as a heavy inefficient vehicle with a huge fuel tank, the latter being able to travel the same distance simply because the tank is so large. It makes sense that Tesla is great at efficiency, they’ve been at this the longest. Lucid, however, has only begun shipping their first cars and yet they’ve beaten all the efficiency of BEVs from legacy manufacturers.
More on efficiency, charging, etc in a future post(s).
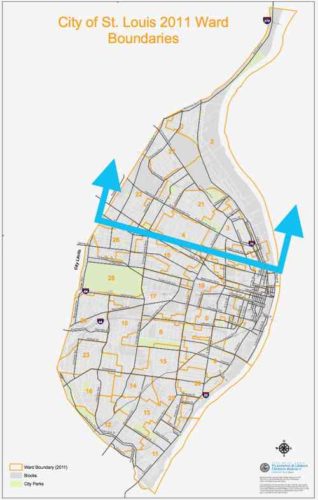
Graphic from November 2020 post showing area predicted to have population loss.
The 2020 Census results results for St. Louis showed what I had predicted, the bulk of our population loss came from northside wards. This was also true in 2010 and in 2020. No reason to think 2030 won’t be more of the same. We can sit back and do nothing, or we can help manage the situation — possibly reducing some losses in future.
By mange I mean see where population is dropping more than in other areas. We can’t just write of a third of our geographic area. I propose a group comprised of experts, residents, business owners, etc to examine data and evaluate possible solutions.
Here is some of the data I’d like to see on a big map(s):
Population by age & race
Parcels of land being used (water connection) vs unused.
Parcels of land with new or substantially renovated structures vs severally deteriorated, condemned, or vacant.
Parcels of land owned by the city, out of state owners, owner-occupied, LLC, .
Historic properties, sites.
Schools, current & former.
Employers and numbers of employees
Crime
Topography
Probably other criteria as well…
Since north city is not declining uniformly we need to see which parts that are doing better than others. Is this because 0f newer housing? Access to transit? All we know at this point is some blocks are stable and occupied while others are rapidly declining. Mapped data can tell us a lot, people on the ground familiar with their area can confirm or dispute what the data tells us. Get everyone on the same page, then reassess every few years and make adjustments as circumstances change for better or worse.
What we all need to accept is that it’s very unlikely these neighborhoods will see a major population growth. Ever. Thus some land can be returned to nature, used for agriculture, etc. The maps will show us the least populated areas with the worst housing stock — contrasted with pockets of denser areas with housing unlikely to be abandoned this decade. I’m not talking about large areas the size of Pruitt-Igoe, NGA-West, or Fairgrounds Park. It might be possible that smaller nature areas could be linked together by a trail system. A few great vacant school buildings not reused for residential might get filled with hydroponics to grow produce.
The major corridors like MLK, Page, Natural Bridge, Kingshighway, Grand, etc should remain. Many connecting streets would also remain. However, it’s possible in some areas we might be able to justify removing unoccupied streets and alleys. As St. Louis begins to look at replacing lead water supply lines those areas that’ll benefit most from the infrastructure investment should get priority over areas that can be back to nature by 2030. Old water & sewer lines might get abandoned completely in isolated areas.
The goal isn’t to cut off services to existing residents, but to use resources to strengthen and grow the existing strong pockets. On a block with say only one resident we can wait until that person moves or dies of old age. The children of longtime residents aren’t really interested in moving into the house their relative refused to leave. Conversely, a nice block with one newly-abandoned house needs help to make sure that one house gets maintenance and reoccupied as soon as possible. Quickly reoccupying a vacant building helps prevent others on the block from also being abandoned.
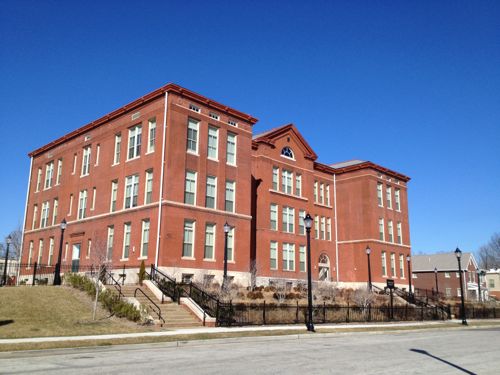
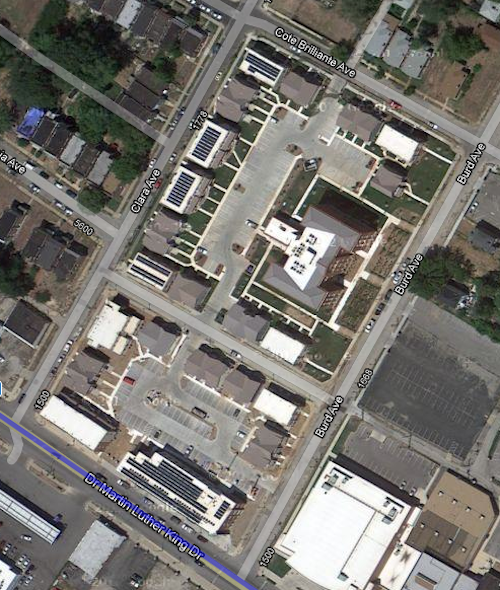
An example of a strong pocket would be MLK & Burd Ave. You’ve the Friendly Temple church and Arlington Grove housing (new housing around a renovated school that’s also housing). Substantial investment has been made, and this is home to many. We can reinforce the positives and look to expand upon that a block at a time.
Former Arlington School has been residential since 2013Aerial after construction completed. Image: Google Maps
Just north of this pocket is a largely vacant area, part of the Wells-Goodfellow neighborhood that has gotten attention for mass demolitions. Other bright spots throughout north St. Louis include numerous tree-lined streets with well-maintained houses — it’s just hard for everyone to see & appreciate the them with so much decay. Whenever I see people wanting to raze vacant “problem” buildings I do get upset, because tearing down buildings in a random manner doesn’t improve neighborhoods for the long-term. It simply removes the current problem while likely speeding up others being abandoned as neighboring owners/residents die or move. By designating different areas for bright spot village and others as moving back toward nature we can reduce fights over razing vs preservation. I can even imagine a decent house in an area set to become nature/agriculture –it might be kept as basically a farmhouse. It wouldn’t necessarily be razed, just reimagined.
Along the way we can reevaluate I-70, an old interstate that winds its way through north city. Can we minimize this as a separating barrier in spots? Can we create areas for interstate drivers to pull off and get a bite to eat while their battery electric vehicle (BEV) charges?
One spot I see as the center of a future village is the intersection of Grand & North Florissant. That’s in part of 2 current neighborhoods, with a 3rd very close. It should be the very center of a thriving area.Why here? The intersection of two corridors should be treated as special. Both Grand and North Florissant are angled toward each other, so a person living or working here can pick either corridor to travel south — southeast on North Florissant or Southwest on Grand. Thanks to the odd street grid they have easy direct access to different parts of the city. Going northwest on North Florissant will eventually get them into St. Louis County.
By 2050 I see north St. Louis as being dotted with nice little villages, with nature in between. Primary corridors will be a line of density with restaurants, retail, offices, and multi-family housing. Rail &/or rubber tire public transit will connect these villages to each other and the larger city & region. I see walking & biking within and between villages. I see jobs growing produce outside and indoors, more jobs along the corridors. I see trees — thousands of them providing some relief from increased temperatures. The major corridors will be tree-lined, many new nature areas will become forests. I see all races, proportional to the mix in the population. Some villages, like The Ville, are predominantly black (75%, not 100%) with strong black-owned businesses. Again I’m talking 30 years, not 3.
What I don’t see are big surface parking lots for big box chain stores. I also don’t see blocks and blocks of obvious vacant residential buildings/lots.
St. Louis should use some of the money from the NFL to kick start the planning process to examine north St. Louis as I’ve described — taking stock and what we have (and don’t have) and then collectively finding solutions to change the trajectory. In the process others could come up with better ideas.
August 26, 2021Environment, FeaturedComments Off on We Saved Money On Our Electric Bill By Switching Rate Plans
For years there was no financial incentive to reduce electricity use during peak periods. Running the dryer & air conditioning while cooking dinner at 5pm weekdays cost the same as doing them at other times. With Ameren Missouri’s new smart meters and Tine of Use (TOU) rate plans reducing electric use during peak demand can save money and reduce peak load on the grid.
A smart electric meter is needed for Time of Use (TOU) rate plans.
At the end of June I posted about signing up for one of the new Time of Use (TOU) rate plans –initially only one was available. Halfway into that billing cycle the other, advanced TOU rate plans became an option for us. I quickly changed plans effective the next cycle.
Now we’ve completed two billing cycles on a basic and an advanced TOU rate plan. Because I’m a spreadsheet nerd I was able to figure out our savings compared to the flat rate plan most still have. The primary savings we realized wasn’t on rates, but on reducing the amount of kWh we used in the billing cycle. Related was a savings on the taxes & fees as all but one are based on kWh. We also saved on the energy used, more with the advanced rate plan than the basic.
Here are some of the details:
Our first TOU billing cycle was the Evening/Morning Savers plan. Like the flat rate, this plan is considered basic. The difference between the peak & off-peak energy is minimal.
For comparison, the summer anytime rate is 11.8¢ per kWh.
This cycle ran from 6/23/2021 through 7/22/2021, the July cycle. We used 652 kWh during this billing cycle. Last year we used 922, in 2019 1,206 — a nearly 30% less than the same cycle last year. Using less energy saved us $31.86 on energy, compared to last year. We saved another $2.31 on additional fees: fuel adjustment, energy efficiency, and renewables. We saved $1.33 on the St. Louis municipal service charge. Add it all up and just reducing our energy use saved us $35.50 for the July billing cycle.
We used 465 kWh off-peak, and 187 kWh peak during the cycle. We saved another $1.02, which isn’t much. However, being on a TOU plan got me thinking about more ways to save that I wouldn’t have done otherwise. Added to the above we saved $36.52, nearly 30%!
With the next billing cycle we were now on the Ultimate Savers TOU rate plan.
Ultimate Savers is Ameren’s most advanced plan, with the biggest differences between peak & off-peak raters. The trick with this plan is an additional “demand charge” based on the hour (6am-10pm) of highest use during the cycle.
I was very nervous about what our bill would be, entirely because of the demand charge. Toward the end of the cycle Ameren’s reports improved significantly, allowing me to see we’d save money. Or at least not spend more — a concern I had initially
Like the July cycle, we reduced our energy use compared to the August 2020 cycle (586 kWh vs 978 kWh) — a 40% reduction! We also used less electricity in August compared to June & July.I’m not going to go through the math again to demonstrate the savings compared to last year, but is was 40% less.
We used 529 kWh of off-peak energy, for a cost of $23.12. Our peak energy was 50 kWh, $12.90. Only 8.6% of our energy was used during peak times — this was mostly cooking dinners. Our hour with the highest kWh used was 3.6 kWh. With a rate of $7.03/kWh our demand charge was $25.31 — this was higher than either our peak or off-peak use. Compared to the Anytime flat rate we saved $6.99 before fees/charges, an effective rate of $0.106 vs $0.118 per kWh.
What I don’t is if we’d be better off on one of the other two advanced TOU rate plans, neither have a demand charge. In a few months Ameren will crunch the numbers and let us know the best plan for us.
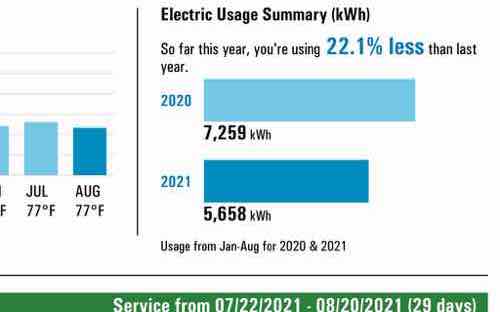
After February 2021 we were using slightly more electricity than last year, but now we’re using 22% less than we did at this point in 2020.
A smart meter like our, above, is required to change to a TOU plan from the Anytime flat rate. See Ameren’s rate options here. In a future post I’ll share other reports from Ameren that detail where we’re using our electricity — our cooking is as much as cooling!
AARP Livibility Index
The Livability Index scores neighborhoods and communities across the U.S. for the services and amenities that impact your life the most
Built St. Louis
historic architecture of St. Louis, Missouri – mourning the losses, celebrating the survivors.
Geo St. Louis
a guide to geospatial data about the City of St. Louis
 A new book explores one of my favorite topics: the overlap of urbanization, capitalism, and disasters. Think our bad habit of developing in flood plains, then acting shocked when levees results in flooding elsewhere. The term “disaster capitalism” is very appropriate.