A Look at AARP Public Policy Institute’s Livability Index
At the beginning of the month I attended Livability Matters: Transportation Choice and Connections — sponsored by Citizens for Modern Transit and others. The day before I was able to interview the event’s primary speaker: Jana Lynott, Senior Strategic Policy Advisor from American Association of Retired Person (AARP)’s Public Policy Institute in Washington D. C.. We talked for an hour in the lobby of her hotel.
First, some background:
AARP’s Public Policy Institute:
The Public Policy Institute informs and stimulates public debate on the issues we face as we age. The Institute promotes development of sound, creative policies to address our common need for economic security, health care, and quality of life.
Jana Lynott, AICP, MA, Senior Strategic Policy Advisor:
Jana Lynott manages AARP’s transportation research agenda and is responsible for the development of policy related to transportation and other Livable Communities issues adopted by the AARP Policy Council and Board and presented in the AARP Policy Book. Her research focuses on human services transportation coordination, accessible street design, the travel patterns of older adults, transit service needs, and older driver safety. She was responsible for the development of AARP’s Livability Index, released in April 2015. This first of its kind on-line tool is designed to help communities better serve an aging population. The Index blends mapping technology, preference survey results, quantitative measures, and public policies to measure how well a location—down to the neighborhood level—is meeting residents’ current and future needs. It uses a scoring system of 60 indicators spread across seven categories of livability: housing, neighborhood, transportation, environment, health, engagement and opportunity.
Prior to her employment with AARP, she was director of transportation planning for the Northern Virginia Transportation Commission, where she designed and managed a groundbreaking study on the link between land use and the mobility of older adults. She also initiated and managed a travel instruction program to teach seniors how to use transit services.
As a land use and transportation planner, she brings practical expertise to the research field. She serves on her county Transportation Commission and on the Transportation Research Board’s Committee for Safe Mobility of Older Persons. She holds a Master of Urban and Environmental Planning from the University of Virginia and a Bachelor of Arts in global studies from the University of Iowa.
The AARP Public Policy Institute developed the Livability Index as a web-based tool to measure community livability. Users can search the Index by address, ZIP Code, or community to find an overall livability score, as well as a score for each of seven major livability categories: housing, neighborhood, transportation, environment, health, engagement, and opportunity. Users also can customize the Index to place higher or lower emphasis on the livability features of most importance to them. The Livability Index website provides resources to help consumers and policymakers use livability scores to effect change in their communities. It is the first tool of its kind to measure livability broadly at the neighborhood level for the entire country, and it is intended to inform and encourage people to take action to make their communities more livable.
During our hour conversation we looked at the Livability Index on her tablet, the categories are:
- Housing
- Neighborhood
- Transportation
- Environment
- Health
- Engagement
- Opportunity
The index is location based:
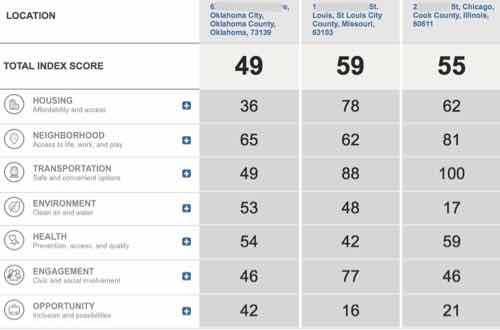
Part of understanding the livability of your location, or prospective location, is understanding how that location compares with other livable communities across the nation. Use our Location Comparison tool to examine the difference between up to three (3) different locations, comparing Livability Categories and the metrics and policies that go into defining them.
This video explains:
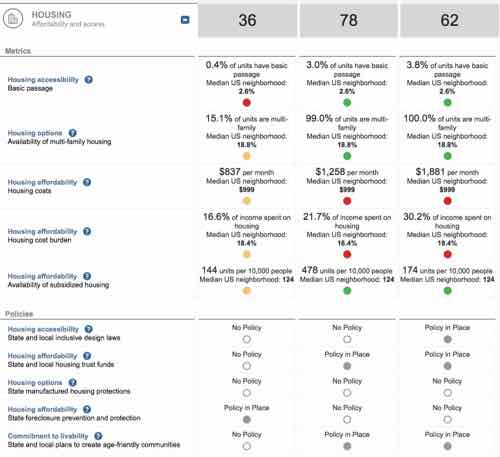
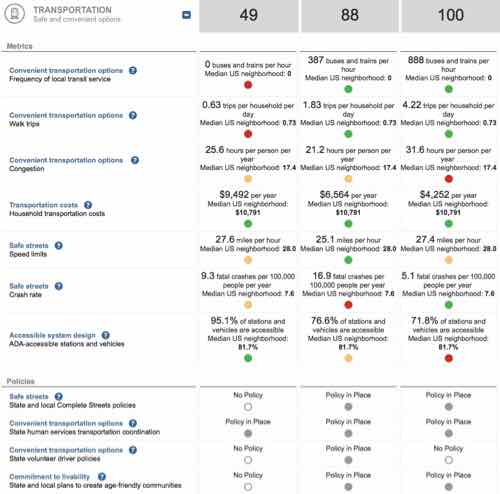
I compared three locations I know well: In the first column is the address where I grew up in Oklahoma City, next is my loft in downtown St. Louis, and last is the condo where we stay in Chicago.
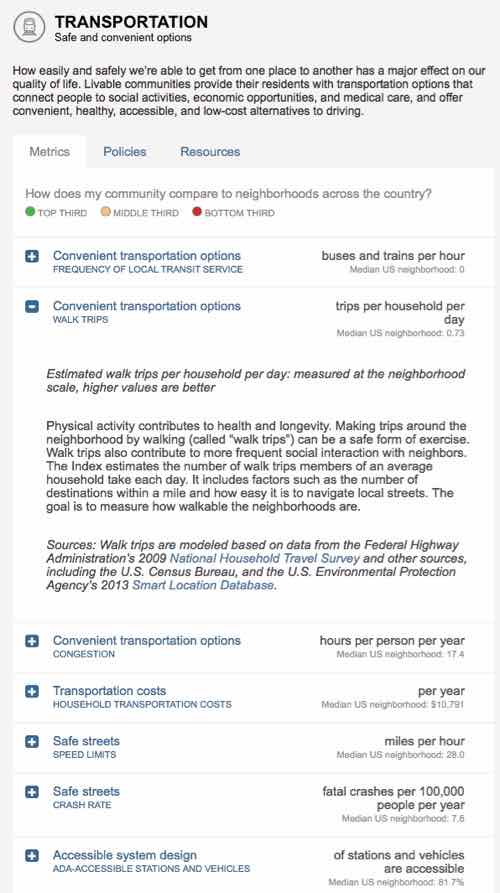
Clicking on the question marks throughout will give you a pop-up with an explanation, for example:
TRANSPORTATION: Safe and convenient options
How easily and safely we’re able to get from one place to another has a major effect on our quality of life. Livable communities provide their residents with transportation options that connect people to social activities, economic opportunities, and medical care, and offer convenient, healthy, accessible, and low-cost alternatives to driving.
From there you can click for more detail:
So check it out here — the link has also been added to the right sidebar.
— Steve Patterson